PROFILE
ThePROFILE keyword is used to analyze the execution characteristics of DQL queries. When you prefix a query with PROFILE, the query executes normally and returns both the query results and detailed profiling information about the query execution.
Example
DQL
Understanding the Output
The PROFILE output includes several key sections:plan: The execution plan showing the operators used to execute the query, similar to EXPLAIN output#stats: Execution statistics for each operator, including document counts and timing informationtimes: Overall query timing breakdown showing parse, plan, and total elapsed timeresultCount: The number of documents returned by the querystate: The current state of the query execution
Important: All timing values in the PROFILE output are measured in nanoseconds. For example, an
elapsed time of 51796819 nanoseconds equals approximately 51.8 milliseconds.Remote Logging
Remote Logging allows you to request and retrieve detailed diagnostic logs from any device in your mesh through the Ditto Portal. This feature is particularly useful for investigating unexpected behavior on devices that may have intermittent connectivity or are deployed in the field.When to Use Remote Logging
Use Remote Logging when you need to:- Investigate bugs or unexpected behavior on specific devices
- Diagnose synchronization issues across your mesh
- Gather diagnostic information from devices in production
- Troubleshoot devices that are difficult to access physically
Remote Logging is designed for retroactive investigation and diagnostics. For real-time log monitoring or integrating Ditto logs into your application’s logging infrastructure, use the SDK’s custom log callback functionality instead.
Requesting Logs from the Portal
You can request logs from devices in two ways:Option 1: Request Full Data Bundle
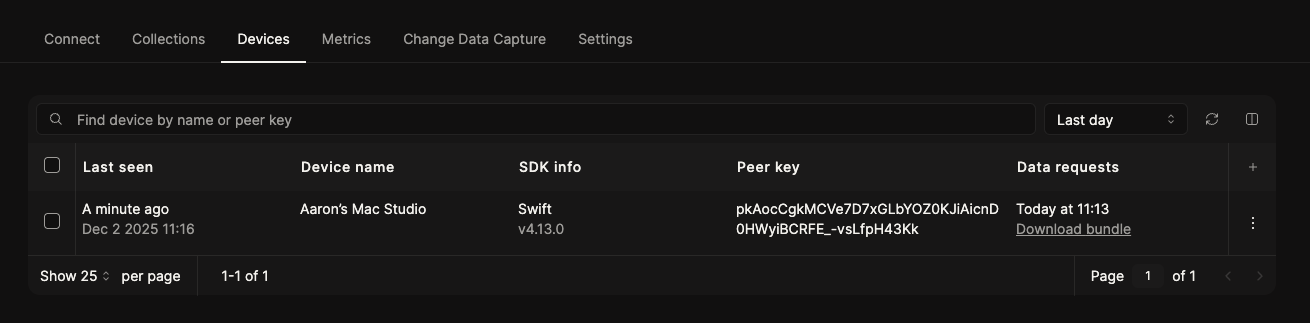
A data bundle includes logs, flamegraphs, and other diagnostic data produced by the Ditto SDK.- Navigate to Devices in the Portal sidebar
- Locate the device you want to investigate in the devices table
- Click the overflow menu (three dots) on the right of the device row
- Click the Request data bundle link for that device
Option 2: Request Logs Only
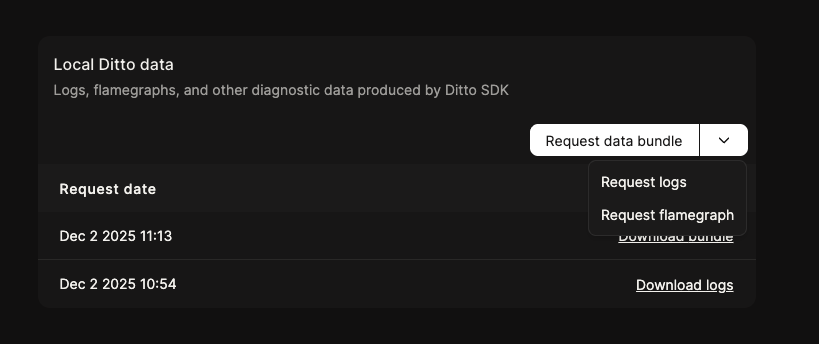
If you only need log files without additional diagnostic data:- Navigate to Devices in the Portal sidebar
- Click on the device to open its detail page
- Scroll down to the Local Ditto data section
- Use the Request data bundle overflow menu (three dots)
- Select Request logs from the dropdown
How It Works
When you request logs from a device:- The request is sent through Ditto’s replication system
- The device receives the request when it’s connected to the mesh
- The device exports its logs and uploads them back through replication
- Once uploaded, a Download link appears in the Portal
- Click the download link to retrieve the log file
The device does not need to be online when you request logs. Both the request and the log upload use Ditto’s replication system, which means they work even with intermittent connectivity and the logs will be uploaded when the device is next connected to the mesh. Be patient if requesting logs from a device that connects infrequently.
- Pending upload: Request sent, waiting for device to process and upload logs
- Download: Logs are ready to download
Understanding Log Files
Exported logs are plain text files where each line contains a structured JSON log entry:- timestamp: When the event occurred
- level: Log level (DEBUG, INFO, WARN, ERROR)
- message: Human-readable description of the event
- target: Which component generated the log
- Additional context-specific fields
Requirements
Remote Logging was introduced in Ditto SDK version 4.4.0. For SDK versions 4.4.0 to 4.7.x:- The “Small Peer Info” feature must be enabled in your SDK configuration
- This feature must be configured to allow replication with the Cloud
- Remote Logging is enabled by default
- No additional configuration required
Limitations
Log Size and Retention: Each device stores up to 15 MB of uncompressed log data OR 15 days of logs, whichever is smaller. This limit is not currently configurable. Full Export Only: Remote log requests export all available logs from the device as a single file. You’ll need to filter by timestamp or other criteria after downloading. Not Real-Time: This feature is designed for diagnostic investigation, not real-time monitoring. There may be a delay between requesting logs and receiving them, especially for devices with intermittent connectivity. Storage: If you need to retain logs for longer than 15 days, you should periodically export and store them outside of Ditto.Troubleshooting
Log Request Stuck on 'Pending Upload'
Log Request Stuck on 'Pending Upload'
If the device is online and connected:
- For SDK versions before 4.8.0: Verify that the “Small Peer Info” feature is enabled in your SDK configuration
- Ensure your SDK is configured to allow replication with the Cloud
- Check that the device is running SDK version 4.4.0 or later
- Be patient - logs will upload automatically when the device next connects to the Cloud
- The request will be processed when connectivity is restored
Downloaded Log File is Empty
Downloaded Log File is Empty
For SDK versions before 4.8.0:
- Verify that logging is enabled in your SDK configuration
- Check that the minimum log level is set to “info” or lower
- If the log level is set to “error”, logs will only appear if errors occurred
- This should not occur - please contact support if you encounter this issue
Logs Don't Cover the Time Period I Need
Logs Don't Cover the Time Period I Need
Cause: Device logs are limited to 15 MB or 15 days, whichever is smaller.Solution:
- Request logs more frequently for devices you’re actively monitoring
- Consider implementing custom log export in your application for critical devices
- Contact support if you need guidance on log retention strategies